

Dashboard
FinOps
The FinOps Dashboard in PF Governance is a centralized financial management and operational analytics hub designed for Tenant Admins and FinOps leads. It provides full visibility into AI consumption, cost attributions, model usage efficiency, operational traffic distribution, and platform capacity limits across all workspaces.
Top Controls & Global Filtering Bar

This bar controls the data context for all charts and cards on the screen:
- Role Indicator & Last Refresh: Displays the active governance view policy (Tenant Admin) along with a live timestamp of the data load.
- Global Workspace Filter: A multi-select dropdown that enables administrators to isolate a single workspace or aggregate metrics across multiple business units.
- Time Range Selector: Preset time-window buttons (24H, 7D, 30D, 90D, Custom) that dynamically recalibrate all metrics, line charts, and tables across the dashboard.
- Export: Triggers a direct CSV download of raw, row-level transaction logs matching the active workspace and time filters for departmental chargebacks and ERP integration.
Pulse Section (High-Level Financial & Usage Metrics)

The Pulse section provides four immediate KPI summary cards highlighting financial velocity and operational scale:
Insights Section (Automated Unit Economics & Cost Drivers)

An auto-generated intelligence banner that calculates spend momentum and pinpoints cost drivers without requiring manual analytics:
- Top Cost Driver: Highlights the specific model generating the largest share of overall spend (e.g., AWS Bedrock Claude Sonnet 4.6 Model, accounting for $135.80 or 94% of total spend)
- Model Cost Momentum: Tracks spend acceleration relative to the prior period
- Run Cost Efficiency: Measures unit economics by calculating the exact cost per execution
- Token Concentration: Identifies token utilization imbalance
Cost Flow Section (Attribution & Trend Analysis)
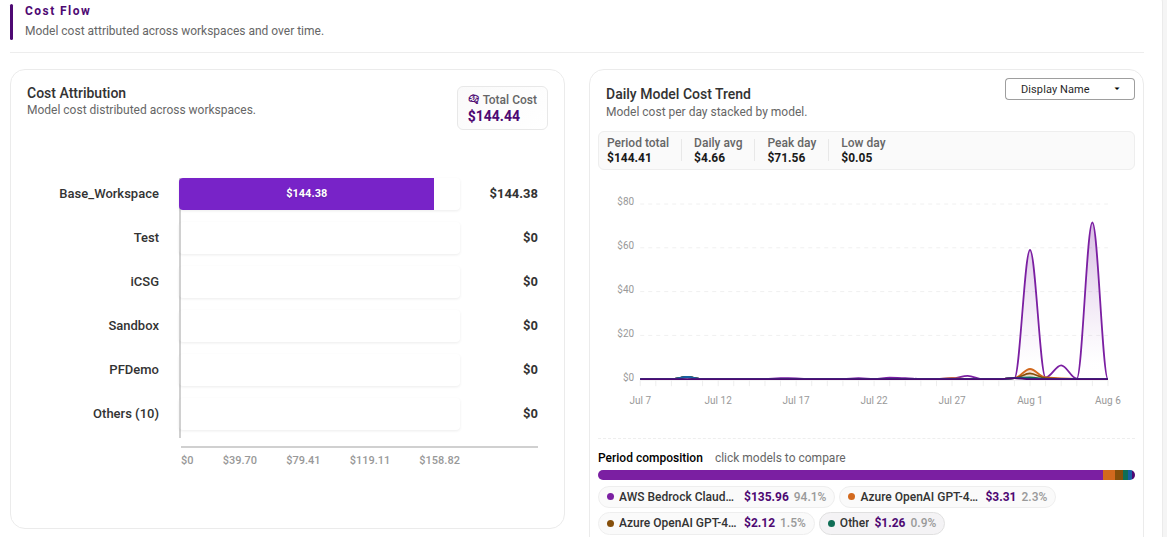
The Cost Flow section breaks down where costs originate and how spend fluctuates over time.
Cost Attribution Bar Chart
- Displays a horizontal cost distribution bar charting model spend assigned to destination workspaces.
- Enables immediate identification of unallocated cost or major spending workspaces (e.g., Base_Workspace at $144.15 vs. iCSG, Sandbox, PFDemo, and kpmg at $0).
Daily Model Cost Trend
- Stacked Line Chart: An interactive trendline charting daily spend per model over time.
- Header Summary Statistics
- Period Composition Bar: An interactive color-coded legend showing model spend share:
Consumption Section (Resource Usage Leaderboards)
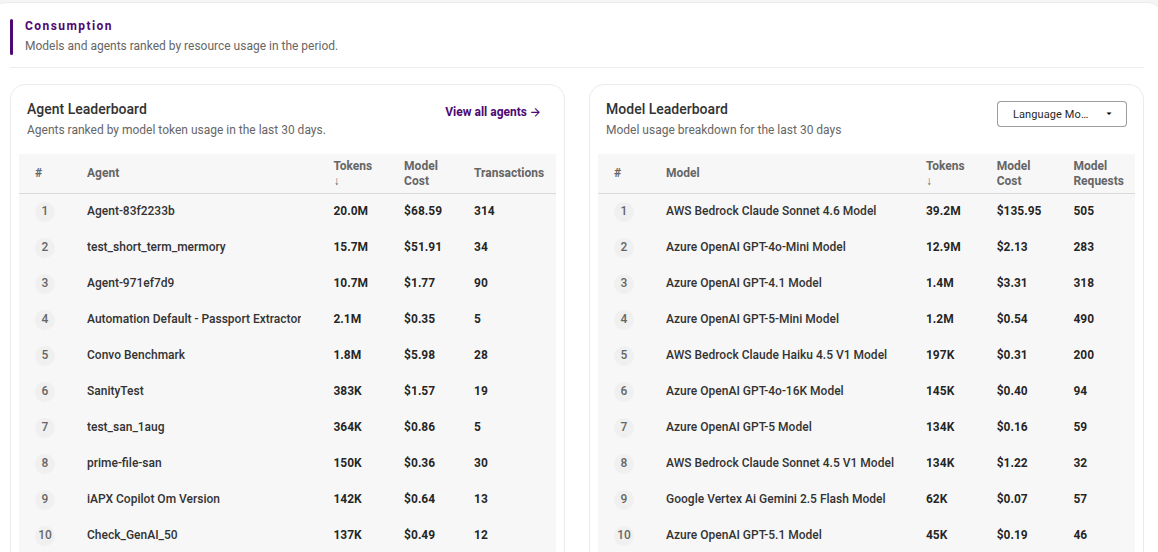
The Consumption section features two detailed leaderboards ranking platform assets and model providers by usage:
Agent Leaderboard
Ranks individual agents by token consumption, detailing resource usage and cost generation
Model Leaderboard
Categorizes usage by model provider and specific LLM variant
Operations Section (Transaction Mix & Volume)
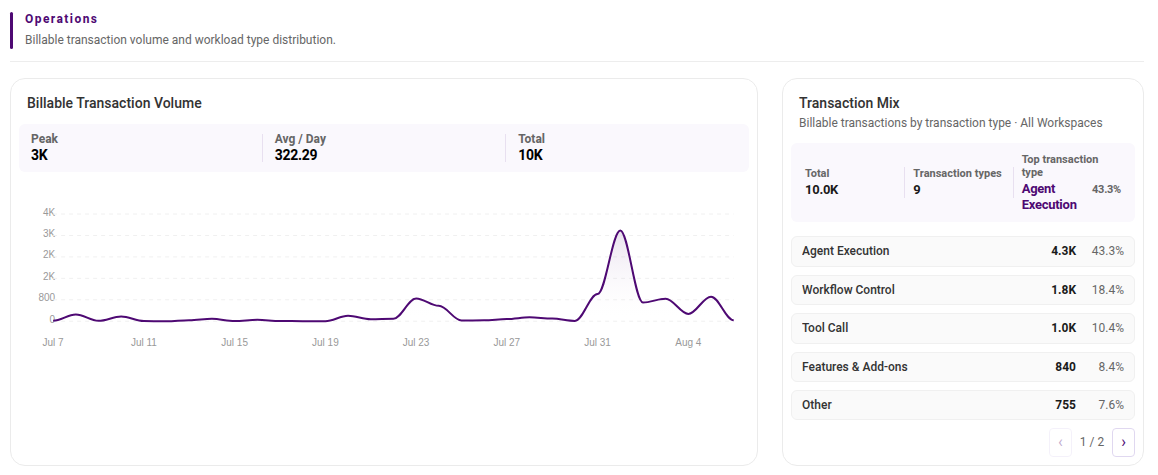
The Operations section details transaction execution patterns and categorizes the underlying operational workloads across the platform.
Billable Transaction Volume Chart
- A visual timeline chart tracking daily run activity over the selected window.
- Key Volumetric Indicators - Peal, Avg / Day and Total
Transaction Mix Breakdown
Categorizes billable transactions by transaction type for Workspaces
Capacity Section (Tenant Storage & Quota Snapshots)
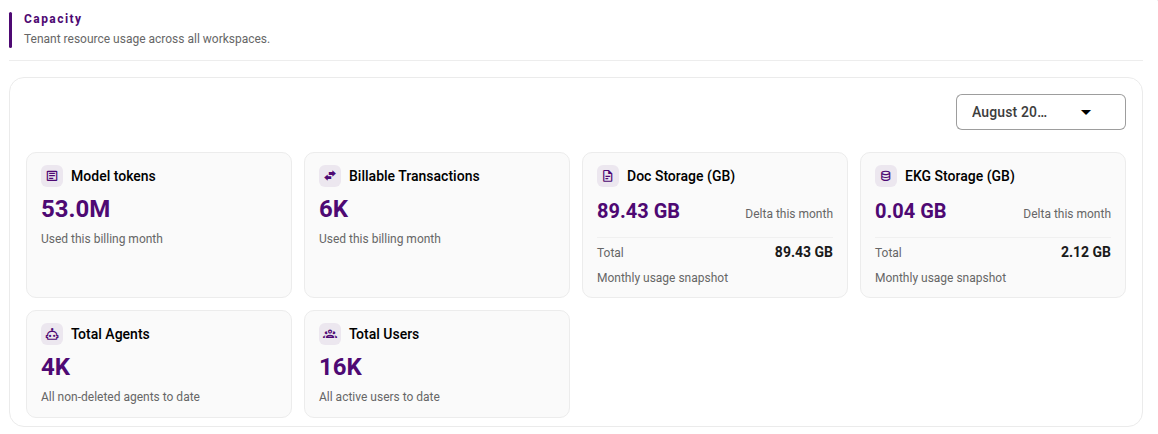
Located at the bottom of the FinOps dashboard, the Capacity section tracks tenant-wide usage against billing limits and resource quotas.
- Billing Period Filter: Allows switching historical snapshots by billing month (e.g., August 2026).
- Quota Tracking Cards:
- Model Tokens: Includes tokens used in the current billing month.
- Billable Transactions: Transactions used in the current billing month.
- Doc Storage (GB): Total document storage footprint.
- EKG Storage (GB): Enterprise Knowledge Graph vector storage.
- Total Agents: Non-deleted agents created across all workspaces to date.
- Total Users: Active onboarded user accounts to date.
Agents
The Agents tab in PF Governance provides AI Operations teams, Tenant Admins, and developers with central visibility into execution volume, success reliability, performance bottlenecks, and a searchable inventory across all agents, agent teams, and automated workflows.
Header & Global Filtering Controls
- Role & System Status: Displays current access policy privileges alongside a real-time data refresh timestamp.
- Global Workspace Filter: Multi-select dropdown to scope view metrics across specific workspace environments.
- Tag & Time Filters: Multi-select tag dropdown alongside fixed evaluation windows that dynamically re-render all dashboard widgets.
Pulse Section (Activity & Reliability Overview)

- Agent & Workflow Runs: Total tenant-wide execution count (e.g., 2.2K runs over the last 30 days, reflecting a -72% change relative to the prior period).
- Success Rate: Overall execution completion reliability (e.g., 72.4%, representing a +65.5 percentage point increase vs. the prior period).
- Transacting Agents & Workflows: Aggregate count of distinct active running assets (e.g., 239 assets, up +42% vs. the prior period).
Watch List Section (At-Risk Diagnostic Tables)
Dual diagnostic tables configured with execution thresholds designed to surface underperforming assets for troubleshooting:
Lowest Success Rate Table - Ranks assets by execution failure rates
Highest Avg Latency Table - Ranks slow-running executions by execution duration
Operations Section (Execution Volume & Failure Trends)
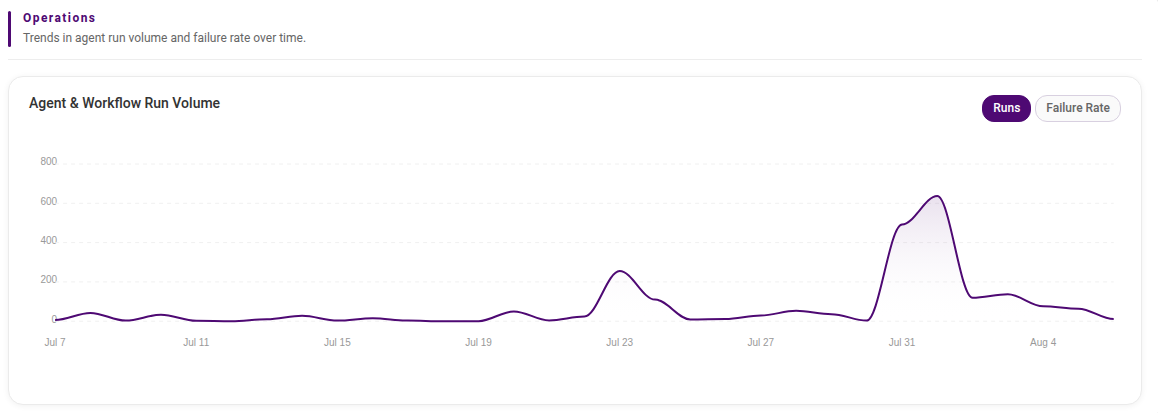
- Agent & Workflow Run Volume Chart: An interactive trendline graphing daily execution volume trajectories.
- Metric Selector Toggle: Buttons in the upper right corner of the chart allow toggling the visual timeline between total Runs volume and overall Failure Rate percentages.
Inventory Section (Tenant Asset Database)
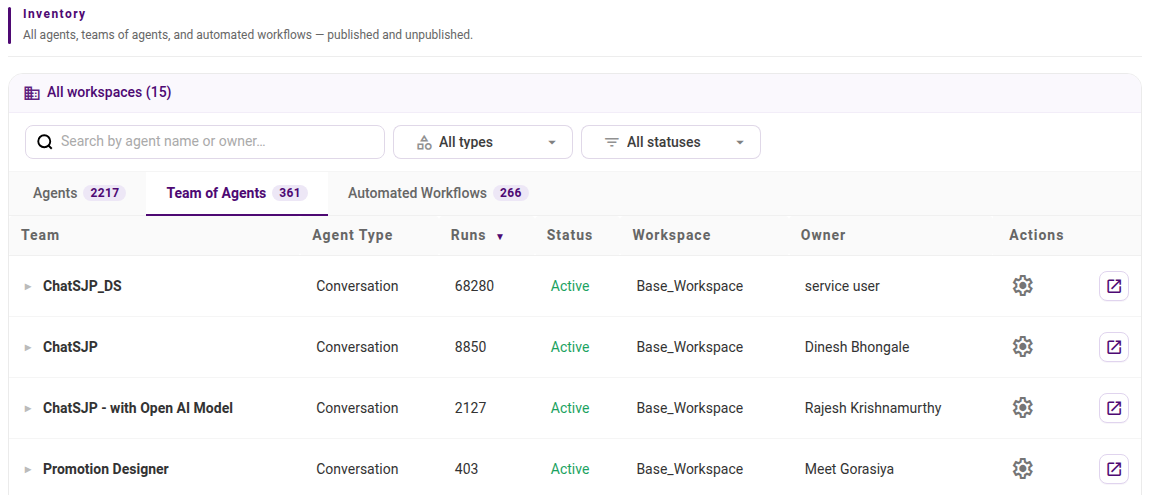
A centralized registry providing searchable access to all platform assets across all workspaces:
- Header Badge: Summarizes workspace coverage
- Asset Category Tabs:
- Agents
- Team of Agents
- Automated Workflows
- Search & Dropdown Controls:
- Keyword search field
- Category dropdown
- Status dropdown
- Grid Columns & Asset Data:
- Agent: Name of the asset
- Agent Type: Classification type
- Runs: Period execution count
- Status: Lifecycle state
- Workspace: Assigned environment
- Owner: Owner account
- Actions: Direct launch link to navigate directly into the asset configuration and execution logs
Enterprise GPT
This dashboard provides real-time and historical analytics on conversational AI usage, financial spend, model token consumption, latency, and system execution status across enterprise chat interactions.
Header & Controls
- Sub-Navigation Views: Features two primary sub-views: Overview (currently active) and Messages (for detailed chat logs).
- Overall Message Counter: Displays the total lifetime platform interaction count (Overall messages: 804) in the top right.
- Time Range Selector Bar
KPI Summary Cards (Pulse Metrics)
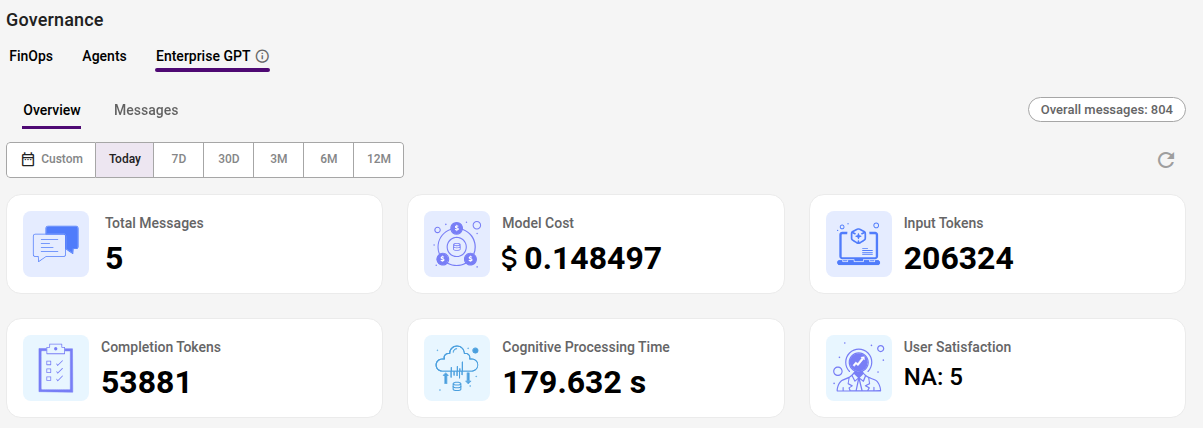
A high-level metric snapshot reflecting execution during the selected timeframe (Today):
- Total Messages: Total chat messages processed during the active window.
- Model Cost: Total financial spend incurred from model API invocations.
- Input Tokens: Prompt/context tokens ingested (prompts, uploaded documents, retrieval context).
- Completion Tokens: Output tokens generated across model responses.
- Cognitive Processing Time: Aggregate latency/reasoning duration across responses.
- User Satisfaction: Sentiment score indicator (showing 5 unrated or non-applicable responses).
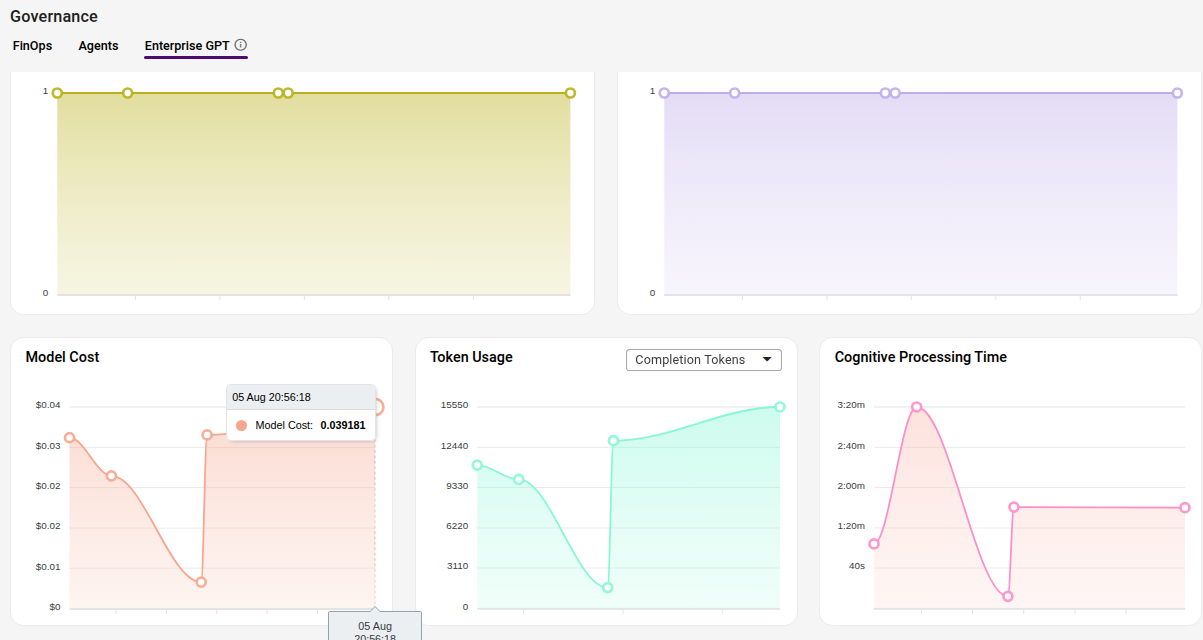
Usage & Adoption Trend Charts
Messages vs. Time
- Metric Tracked: Number of messages exchanged per session over the selected window.
- Current Data: Shows steady, low-volume interaction points capped at 1 message per discrete event interval.
Users vs. Time
- Metric Tracked: Active distinct end-users interacting with Enterprise GPT chat over time.
- Current Data: Displays a constant line at 1 active user, showing single-user testing or limited active adoption during this period.
Cost, Token & Latency Analytics
Model Cost Over Time
- Metric Tracked: Spend progression ($ USD) per message interaction over time.
- Current Data: Shows fluctuations ranging between $0.00 and $0.04 per invocation, with peaks reaching ~$0.038 on complex queries.
Token Usage
- Metric Tracked: Token throughput over time, with a dropdown to toggle between Completion Tokens (currently displayed) and Input Tokens.
- Current Data: Response generation output ranges between ~1,500 and ~15,550 completion tokens per execution step.
Cognitive Processing Time
- Metric Tracked: Response latency and reasoning duration per prompt execution.
- Current Data: Shows latency variations with a peak execution duration near 3 minutes 20 seconds (3:20m), stabilizing down to around 1 minute 40 seconds (1:20m) for standard prompts.
Execution Health (Message by Status)
A donut chart and categorical breakdown summarizing the status of messages processed over the last 24 hours:
- Completed - Messages successfully processed and delivered to the user.
- Initiated - Messages currently queued.
- In Progress - Messages actively generated.
- Failed - Messages that encountered execution or API errors.
The remaining segment represents unlisted or historical system states totaling 5 total messages).